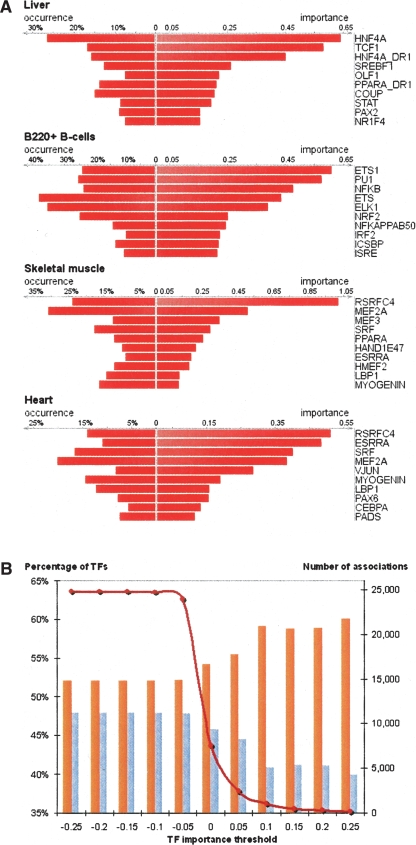
Figure 4.
Importance and occurrence of individual TFs in candidate enhancers corresponding to mouse liver, B-cells, heart, and skeletal muscle (A). Binning of 25 k predicted TF-tissue associations by a minimal TF importance threshold (B). The number of TF-tissue associations almost does not change in the area of negative TF importance thresholds and rapidly decreases in the area of positive TF importance thresholds (dark red graph; right y-axis) indicative of a small number of TFs with large positive importance values and an even smaller number of TFs with large negative importance values. The percentage of TF-tissue associations that are confirmed by an increase in TF gene expression (orange bars) increases with the increase of minimal TF importance (followed by the corresponding decrease in the number of nonconfirmed associations—blue bars). As ∼60% of predicted TF-tissue associations with a minimal TF importance of 0.1 are supported by an increased level of TF gene expression in the corresponding tissue, this threshold could serve as a cut-off of reliability in TF-tissue association predictions.

