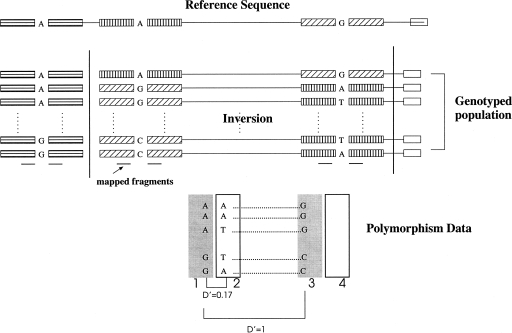
Figure 1.
Unusual LD observed in SNP data when the inverted haplotype (with respect to the reference sequence) has very high frequency. SNPs are “mapped” to the reference sequence using the flanking sequence (denoted by shaded boxes). Therefore, close SNPs in high LD are mapped to distant regions 1 and 3 (the shaded boxes). Consequently, the two regions show unusually high LD for that distance.

