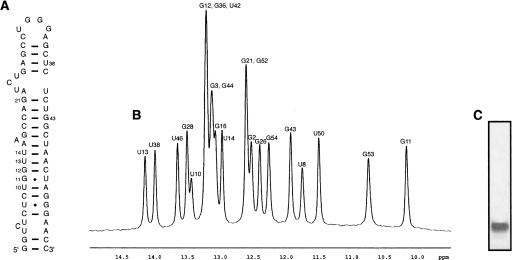
FIGURE 3.
RNA sample purity. (A) The secondary structure of the TAR RNA is shown. (B) Imino proton region of 1D 1H NMR spectra of HIV TAR RNA purified by size-exclusion chromatography. Assignments are indicated numerically above the peaks. (C) Denaturing 10% TBE gel of the NMR sample used in B, stained with toluidine blue.

