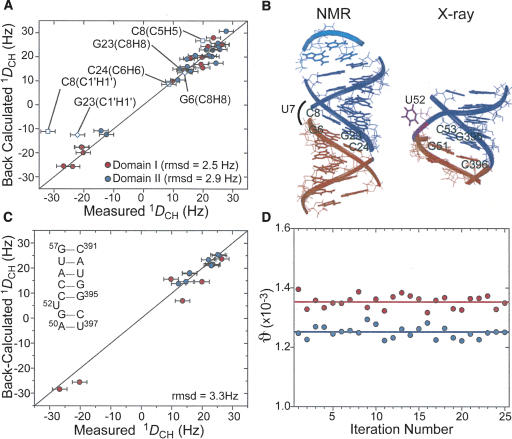
FIGURE 3.
Order tensor analysis of RDCs measured in P4 in the absence of Mg2+. (A) Correlation plot between measured RDCs and back-calculated values when independently fitting order tensors to an idealized A-form geometry for domains I (red) and II (blue). Error bars represent the RDC measurement uncertainty (2.4 Hz). RDCs from residues C8 and C24 (open squares) and G23 and G6 (open diamonds) are shown but C8 and G23 were not included in the singular value decomposition fit. (B) The RDC derived average interdomain orientation obtained from superimposing order tensor frames (left). For comparison, the X-ray structure of P4 in B. stearothermophilus (Kazantsev et al. 2005) is also shown (right). (C) Correlation plot between measured and back-calculated RDCs when fitting RDCs against the X-ray structure of P4 (Kazantsev et al. 2005). RDCs from domains I and II are shown in red and blue, respectively. Inset shows residues common to both the NMR construct and crystal structure (Kazantsev et al. 2005). (D) The best-fit GDOs for domains I (red) and II (blue) as a function of input RDCs over 25 iterations (circles) upon the removal of two random RDCs. Best-fit values when using all RDCs in each domain are shown as horizontal lines.

