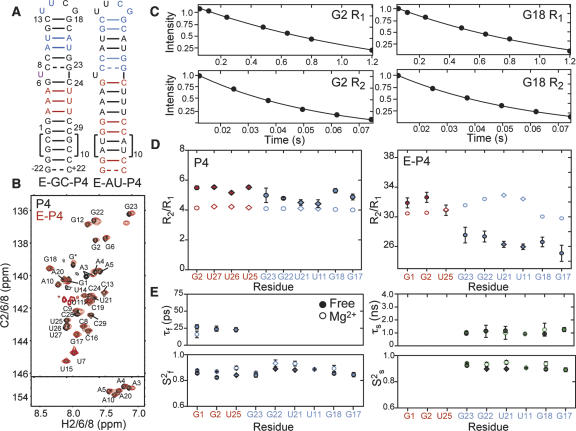
FIGURE 4.
Measurement and extended model-free analysis of E-P4 15N relaxation data in the absence of Mg2+. (A) Secondary structure of E-GC-P4 and E-AU-P4. 13C/15N labeled and unlabeled residues are shown in color and black, respectively. (B) 2D 1H–13C HSQC spectra of aromatic region of E-GC-P4+E-AU-P4 (red) overlaid on non-elongated P4 (black). Natural abundance signals from elongation residues are indicated with an asterisk. (C) Examples of 15N R 1 and R 2(CPMG) monoexponential decays in E-P4. (D) The measured R 2/R 1 values for guanine (filled circles) and uridine (filled diamonds) residues in domains I (red) and II (blue) of P4 (left) and E-P4 (right). Values predicted using hydrodynamic calculations are shown as open symbols. (E) Dynamical parameters for E-P4 derived from extended model-free analysis (Lipari and Szabo 1982; Clore et al. 1990). Shown are the time constants/amplitudes for fast (τf/S2 f) and slow (τs/S2 s) internal motions in the absence of divalent ions (filled symbols) and in the presence of 15 mM MgCl2 (open symbols).

