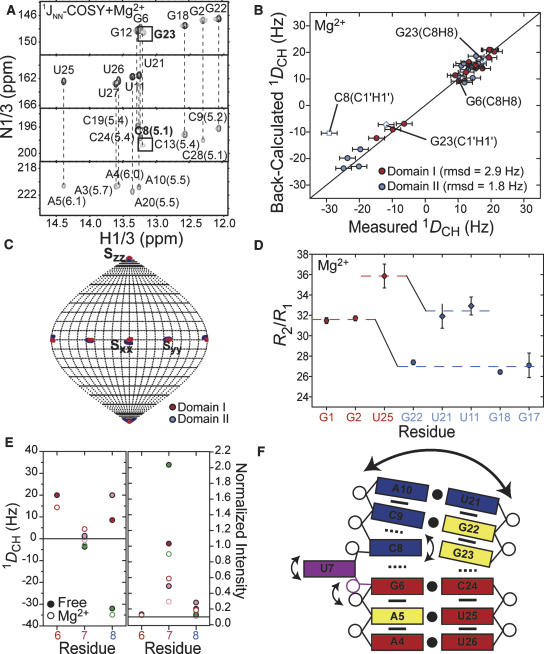
FIGURE 7.
Structural dynamics of P4 in the presence of Mg2+. (A) JNN-COSY spectrum of P4 in Mg2+. The 2hJNN coupling constants (in hertz) are shown next to each cross peak (Dingley et al. 1999). (B) Correlation plot between P4 RDCs measured in 20 mM Mg2+ and values back-calculated when independently fitting order tensors to an idealized A-form geometry for domains I (red) and II (blue). Error bars represent measurement uncertainty (2.4 Hz as for free, Fig. 3A). RDCs from residues C8 (open squares) and G23 (open diamonds) are shown but were not included in the analysis. (C) Orientation of order tensor frames (Sxx, Syy, and Szz) for domains I (in red) and II (in blue) determined in the presence of Mg2+. Results are shown relative to the free P4 interhelical conformation determined using RDCs in the absence of Mg2+. (D) 15N R 2/R 1 values for guanine (circles) and uridine (diamonds) residues measured in P4 in the presence of 15 mM Mg2+. Average values for each domain are shown as dotted lines. (E) One-bond C–H RDCs in P4 (left) and normalized intensities in E-P4 (right) in the bulge and flanking residues measured in the absence (filled symbols) and presence (open symbols) of MgCl2. (F) Schematic diagram of local and global motions in P4 and Mg2+ association (yellow residues).

