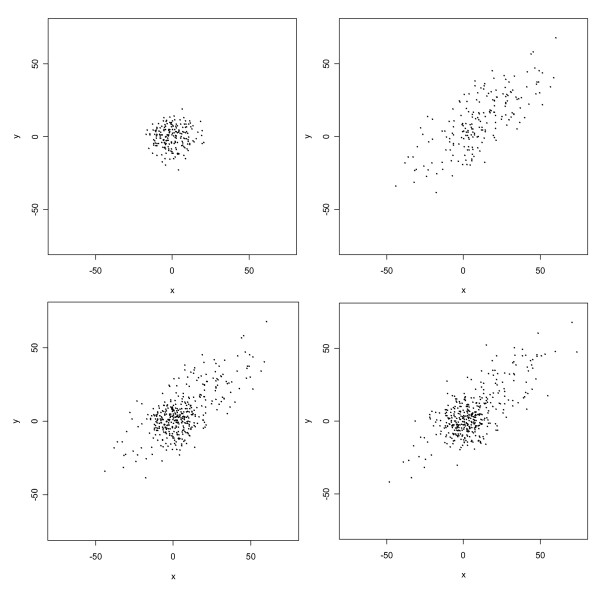
Figure 1.
Scatterplot of simulated data from two-component bivariate normal mixture model. The upper left panel displays 200 observations from the first component; the upper right panel displays 200 observations from the second component; the lower left panel is a superposition of the two upper panels; and the lower right panel displays a new simulation of 400 observations from the two-component normal mixture model fitted to the data from the original simulation.

