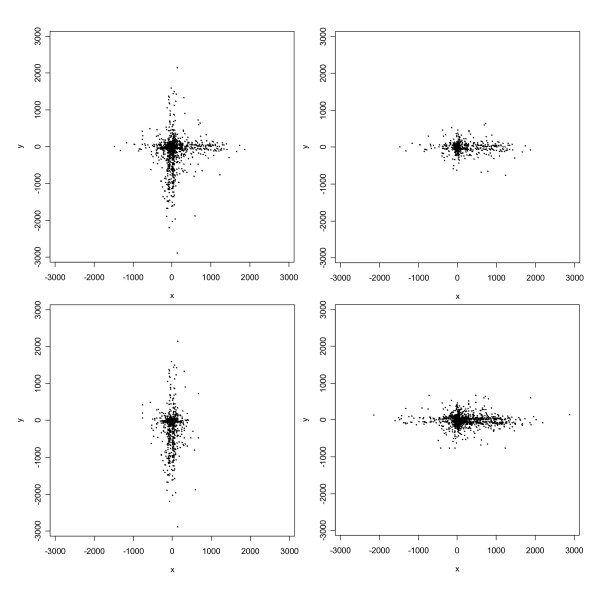
Figure 2.
Scatterplot of positional errors (in meters) for the automated geocodes. The upper left panel displays the complete data; the upper right panel displays errors for addresses on streets aligned E-W; the lower left panel displays errors for addresses on streets aligned N-S; and the lower right panel is a superposition of the upper right panel and a 90-degree counterclockwise rotation of the lower left panel.

