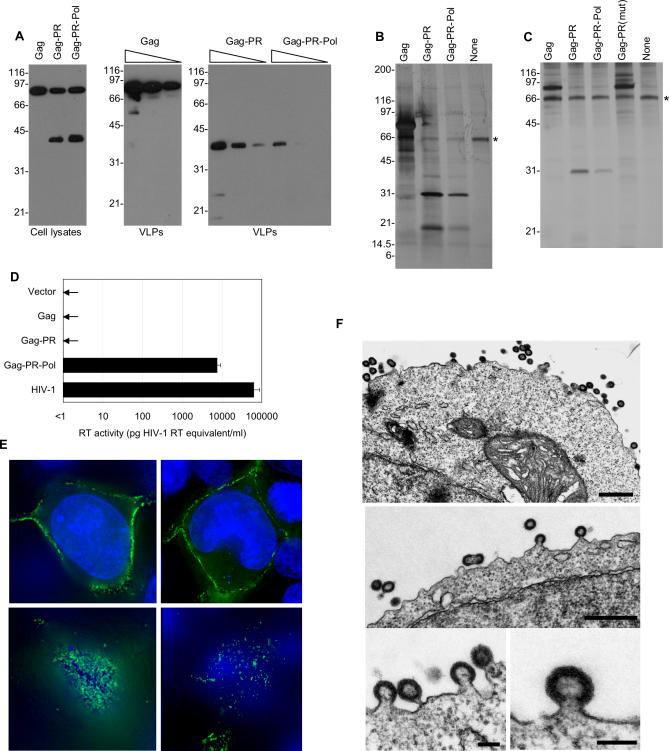
Figure 2. Assembly, Processing, and Release of HERV-K Virus-Like Particles.
(A–D) 293T cells were transfected with Gag-, Gag-PR–, or Gag-PR-Pol–expressing vectors.
(A) Western blot analysis of cell lysates (left) and virions (center and right) using a commercially available antibody to HERV-K Gag. Center shows VLPs from 293T cells transfected with a plasmid-expressing Gag, and right shows VLPs from Gag-PR– and Gag-PR-Pol–expressing 293T cells. Decreasing amounts of virion lysate (0.1, 0.05, or 0.025 μl for Gag; 0.4, 0.2, or 0.1 μl for Gag-PR and Gag-PR-Pol) were loaded to semiquantitatively estimate relative levels of VLP production.
(B) Silver stain analysis of a 4% to 20% gradient SDS-PAGE gel loaded with VLPs harvested from 293T cells transfected with plasmids expressing Gag, Gag-PR, Gag-PR-Pol, or empty plasmid control. An asterisk marks a nonspecific 66-kDa protein band, most probably BSA, that is abundant in the culture medium.
(C) Silver stain analysis of VLPs harvested from 293T cells containing Gag, Gag-PR, Gag-PR-Pol, or Gag-PR(mut) encoding an active site mutation (DTG-AAA) in protease. An asterisk marks a nonspecific 66-kDa protein band, most probably BSA, that is abundant in the culture medium.
(D) Reverse transcriptase activity in culture supernatants of 293T cells transfected with empty pCRV1 (vector) or vectors expressing HERV-KCON Gag, Gag-PR, or Gag-PR-Pol proteins, as indicated. Enzymatic activity was determined relative to a recombinant HIV-1 reverse transcriptase standard and is representative of three experiments. Supernatants from 293T cells transfected with an HIV-1–based proviral plasmid are included for comparison.
(E) Two representative 293T cells transfected with HERV-KCON Gag and Gag-GFP expression plasmids. Cells were fixed 18 h post-transfection, and nuclei were stained with DAPI (blue) prior to visualization by deconvolution microscopy. Top, Images acquired at the mid-section of the cell to show localization of Gag-GFP proteins; bottom, focused on the bottom of the cell to show accumulated VLPs at the cell–coverslip interface.
(F) Gallery of electron micrographs of 293T cells transfected with a Gag-PR–expressing plasmid. Black scale bars in the upper and middle panels represent 500 nm, while scale bars in the lower two panels represent 100 nm.

