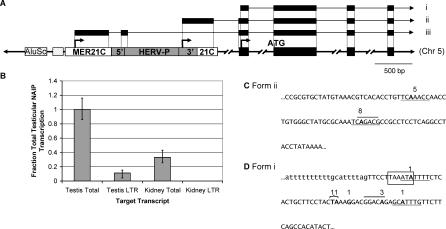
Figure 1. Contribution of LTR Promoters to Human NAIP Transcription and a Summary of 5′ RACE Results.
(A) Representation of a 5′ region of human NAIP gene. Transcription initiates at arrows situated above the underlying genomic DNA, with representative RNAs pictured above. Black boxes represent exons in DNA and RNA forms. White boxes represent a solitary MER21C LTR into which a HERV-P element has inserted (gray box). Sections of the HERV-P labeled 5′ and 3′ represent the 5′ and 3′ LTRs of this partly deleted ERV. Both the MER21C and the HERV-P are oriented in the same transcriptional direction as the NAIP gene. The boxes to the left of the MER21C denote an AluSc SINE and an MIR SINE (unlabeled). Three TSSs for human NAIP have been reported or were identified here: isoform i is found in all tissues tested, while ii represents the testis-specific HERV-P start site, and iii represents the published TSS determined in the THP1 leukemic cell line [21].
(B) Quantitative real-time RT-PCR analysis of human testis and kidney cDNA to determine contribution of the HERV-P LTR promoter to total NAIP transcription. Total transcript levels were determined using primers that amplify all of the most prevalent transcript forms, and LTR-driven transcripts were determined using one primer in the LTR (see Figure S1A for locations of primers and Materials and Methods for details). Expression levels are normalized to GAPDH and represented relative to total NAIP transcript levels in testis. Assays were carried out in duplicate and repeated three times in testis and two times in kidney.
(C) Partial sequence of the HERV-P element (5′ end corresponds to Chromosome 5: 70,355,179 of the human March 2006 genomic assembly) underlying testis-specific TSSs of NAIP. The numbers of sequenced 5′ RACE clones aligning to particular TSSs are shown above the sequence. The putative TATA box identified previously in HERV-P LTRs [26] is at the end of the sequence shown.
(D) Underlying sequence and TSSs determined for the non-LTR promoter (Chromosome 5: 70,352,387) in blood, liver, placenta, and testis. Lowercase letters distinguish intron/exon boundary. Two 5′ RACE clones aligned upstream of the intronic sequence shown. Numbers above boldfaced nucleotides indicate sites of transcription and the number of 5′ RACE clones that align to each TSS. Underlines and overlines indicate putative initiator elements and downstream promoter elements, respectively [25]. Boxed sequence represents a putative TATA box. Full characterization of human UTRs can be found in Figure S1.

