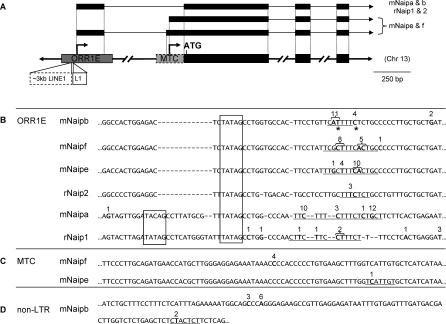
Figure 2. Contribution of LTR Promoters to Mouse and Rat Naip Transcription and a Summary of 5′ RACE Results.
(A) Representation of 5′ region of rodent Naip genes. Transcription initiates at arrows situated above the underlying genomic DNA, with representative RNAs pictured above. Gray shaded boxes represent the solitary LTR insertions, and black boxes represent exons in DNA and RNA forms. Mouse and rat Naip transcription predominately initiates in ORR1E LTRs. mNaipe and mNaipf have an MTC LTR (dashed gray box) and ∼3 kb of L1_Mus1 LINE1 sequence has integrated into the ORR1E LTRs associated with these two genes, shown by a dashed white box. The rNaip2 ORR1E LTR has also been interrupted by an independent insertion of 300 bp of Lx2A1 LINE1, shown by solid white box.
(B) Partial alignment of the rodent ORR1E LTRs associated with Naip transcription. The 5′ end of the sequences shown corresponds to the following coordinates in the mouse (mm8) and rat (rn4) draft sequences. (mNaipa = Chromosome 13: 101,553,198; mNaipb = Chromosome 13: 101,302,420; mNaipe = Chromosome 13: 101,347,641; mNaipf = Chromosome 13: 101,418,005; rNaip1 = Chromosome 2: 31,268,656; rNaip2 = Chromosome 2: 31,204,793). Numbers above boldfaced nucleotides indicate sites of transcription initiation and the number of 5′ RACE clones obtained that align to each TSS. A few mNaipe clones aligned beyond the boundaries of the ORR1E sequence shown. Underlines indicate putative initiator elements and boxed sequence represents putative TATA boxes. Asterisks denote sites of transcription that are supported by >1 CAGE tag [27].
(C) Partial alignment of the mNaipe/f MTC alternative promoters. (mNaipe = Chromosome 13: 101,346,591; mNaipf = Chromosome 13: 101,416,943).
(D) Genomic sequence surrounding the mNaipb non-LTR promoter (mNaipb = Chromosome 13: 101,289,682). Full characterization of mouse UTRs can be found in Figure S2.

