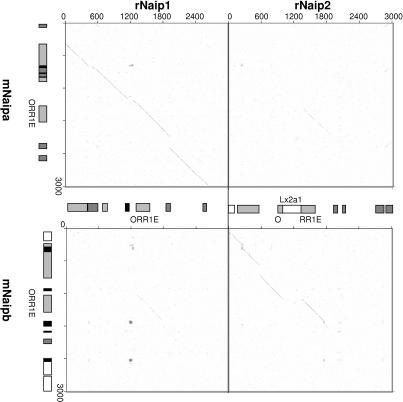
Figure 6. Comparison of Genomic Sequence Surrounding the Rodent Naip ORR1E LTRs.
3 kb of sequence centered around the ORR1Es was analyzed by dot plots; diagonal lines represent regions of homology between compared sequences. Light gray, dark gray, white, and black boxes represent LTR elements, SINEs, LINEs, and simple repeats, respectively.

