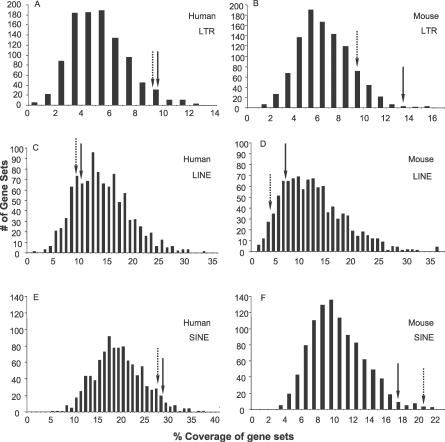
Figure 7. Density of TE Sequence in 5′ Flanking Regions of IAP Genes Compared to Random Gene Sets.
Coverage of LTRs, LINEs, and SINEs in human (A, C, and E) and mouse (B, D, and F) was assessed in a 12.5-kb window surrounding database-annotated TSSs, 10 kb upstream and 2.5 kb downstream of the eight human and eight mouse IAP genes. These values, shown by solid arrows, were compared to the coverage of each type of repeat for 1,000 sets of eight random human and eight random mouse genes. For the human IAP genes, while SINE enrichment approaches significance (95th percentile), LTRs are significantly enriched (97th percentile), and LINEs are not overrepresented (20th percentile) within the analyzed windows. For the mouse IAP genes, both LTRs (99th percentile) and SINEs (98th percentile) are significantly enriched around the IAP 5′ termini, while LINEs are not (18th percentile). Dashed arrows show retroelement coverage in the same window for IAP genes when the NAIP genes themselves are removed from the analysis.

