
Figure 10.
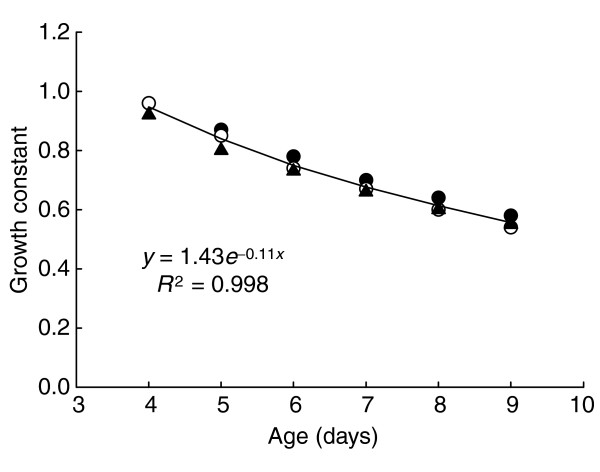
Variation in growth rate constant. Empirical growth data for three different strains: H (filled circles), B (triangles) and D (open circles), shows that all have the same rate of decay of the growth constant.
Official websites use .gov
A
.gov website belongs to an official
government organization in the United States.
Secure .gov websites use HTTPS
A lock (
) or https:// means you've safely
connected to the .gov website. Share sensitive
information only on official, secure websites.
Variation in growth rate constant. Empirical growth data for three different strains: H (filled circles), B (triangles) and D (open circles), shows that all have the same rate of decay of the growth constant.