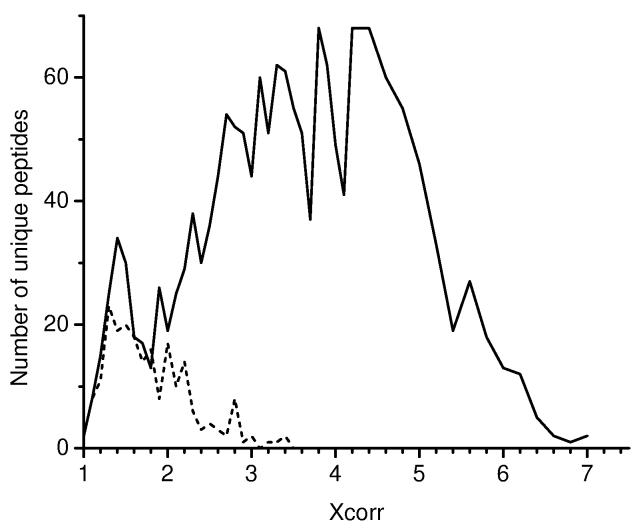
Figure 5.
Relative frequency of different peptides identified from the normal human protein database (solid line) and the reversed human protein database (dashed line) at different Xcorr values. Data shown are for the 2+ charge state fully tryptic peptides identified from human plasma and filtered with ΔCn ≥ 0.1.

