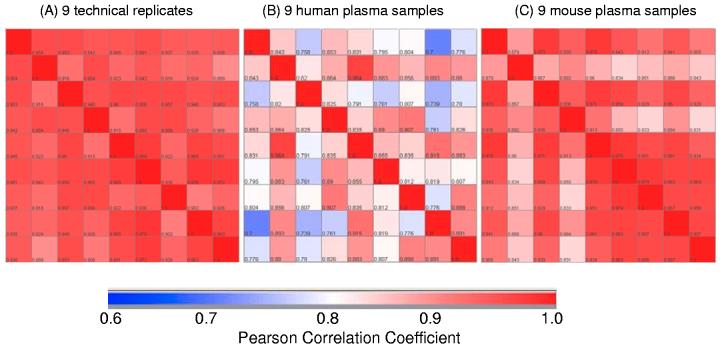
Figure 8.
Pearson correlation plot comparing peptide intensities of LC-FTICR analyses of plasma samples. (A) Nine technical replicates for a pooled reference plasma sample from multiple healthy subjects. (B) Nine human plasma samples from individual healthy subjects with ages range from 18-26. (C) Nine mouse plasma samples isolated from individual C57BL6 mice. Each sample including the technical replicate was separately processed by ProteomeLab™ IgY-12 (for human) or IgY-R7 (for mouse) depletion and the flow-through portions were digested with trypsin prior to LC-MS analyses.

