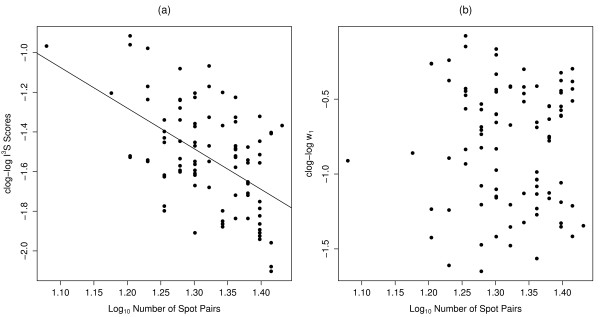
Figure 7.
Effects of spot-pair number. (a) Relationship between complementary log-log-transformed (clog-log) I3S scores and log10-transformed number of spot pairs. The fitted line illustrates the correlation observed using a linear regression; (b) Comparison of clog-log-transformed w1 with log10-transformed number of spot pairs.

