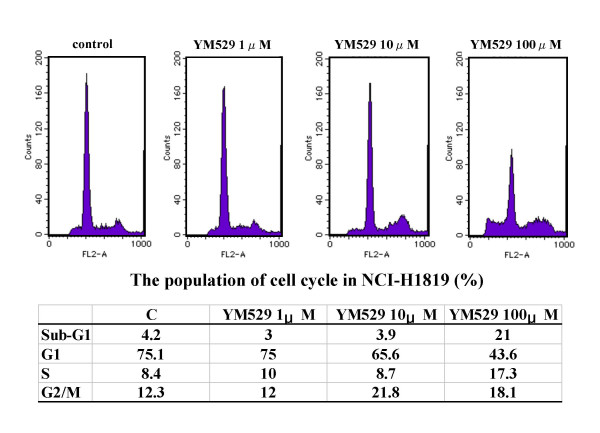
Figure 3.

Cell cycle analysis of NSCLC cells treated with YM529. NCI-H1819 cells were stained with PI after 24 hours exposure of no treatment (control), 1, 10 100 μM of YM529. There were analyzed by flow cytometry. DNA histgram of control (A), YM529 1 μM (B), YM529 10 μM (C), YM529 100 μM (D) were shown. The percentages of the cell population in the different phase (sub-G1, G1, S, G2/M) of cell cycle were analyzed by CELLQuest. Percentages of apoptosis were measured as sub-G1 content of histogram. Similar results were obtained in three independent experiments.
