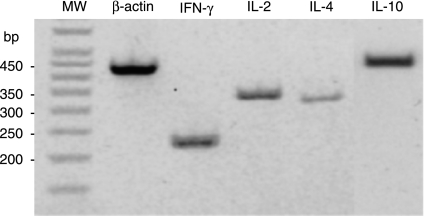
Figure 3.
Agarose gel (2%) showing the size of PCR product amplified by each primer set. Total RNA, extracted from PPD-B-stimulated PBMC, was reverse transcribed to cDNA and defined sequences were amplified using specific primers for bovine β-actin, IFN-γ, IL-2, IL-4 and IL-10. MW (molecular weight) markers are shown in a 50-bp step ladder. PCR results were scored relative to β-actin (+ + +) as positive control. For example, the above bands for IFN-γ, IL-2 and IL-10 were scored (+ +) and IL-4 was scored (+).

