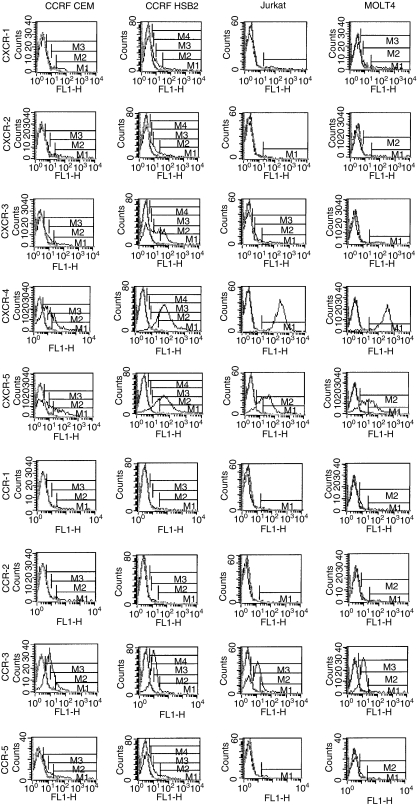
Figure 4.
Chemokine receptor expression does not differ between infiltrating and non-infiltrating T cells. The figure shows flow cytometry analysis of the expression of chemokine receptors in two infiltrative (CCRF HSB2, CCRF CEM) and two non-infiltrative (MOLT4, Jurkat) T-leukaemia cell lines. A high percentage of the T-cell lines were CXCR-4, CCR-3 and CXCR-5 positive. The T-cell lines showed a variable expression of CXCR-1, CXCR-2, CXCR-3 and CCR-5, and a low expression of CCR-1, CCR-2 and CCR-6 (data not shown). The symbols M1-4 denote different comparisons of the area under the curves of the immunoglobulin G (IgG) control and the monoclonal antibodies to the chemokines, respectively.

