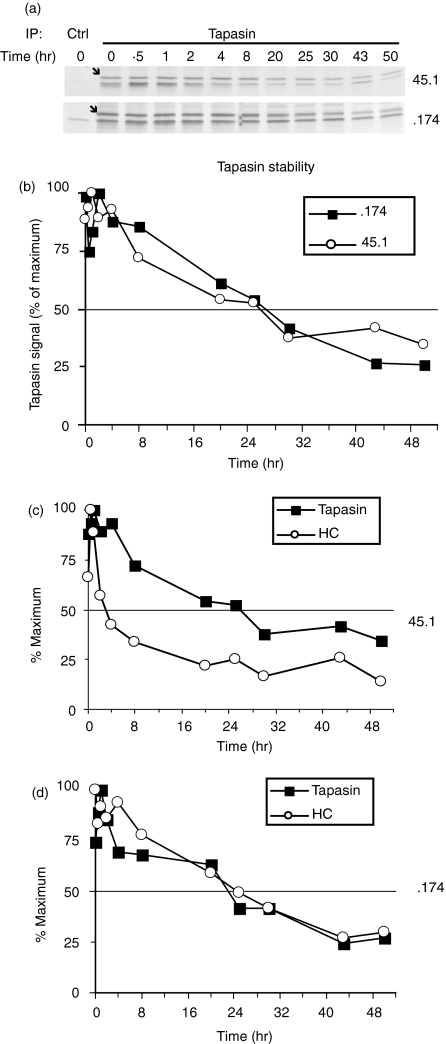
Figure 2.
Kinetics of tapasin–major histocompatibility complex (MHC) class I interactions in the presence or absence of transporter associated with antigen processing (TAP). Pulse–chase analysis of 45.1 and of TAP-deficient .174 cells was performed by using the tapasin-specific antibody R.gp48C. Eluted proteins were electrophoresed on 12% polyacrylamide gels (a). Quantification of the tapasin (bands marked with an arrow) and MHC class I bands from (a) are shown in (b), (c) and (d). (b) Comparison of tapasin stability in 45.1 (open circles) and .174 cells (closed squares). (c) and (d) Analyses of 45.1 and .174 cells, respectively, for tapasin (closed squares) and associated heavy chains (HC, open circles).

