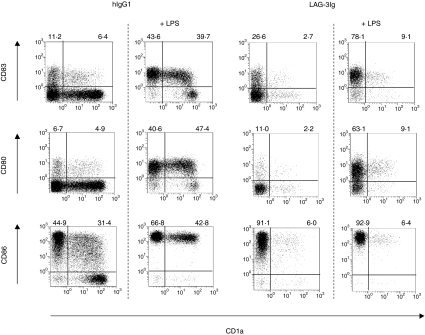
Figure 4.
LAG-3-differentiated cells show normal expression of costimulatory (CD80/B7.1, CD86/B7.2) and CD83 molecules. Dot plots of double-stained DC derived from hIgG1- or sLAG-3-treated monocytes stimulated or not with LPS (10 ng/ml) are shown. The percentage of positive cells for each marker is indicated. One representative result of five independent experiments is shown.

