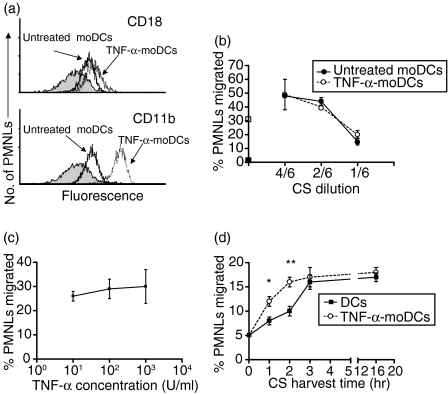
Figure 1.
Polymorphonuclear leucocyte (PMNL) activation (a) and migration (b, c and d). (a) CD18 and CD11b expression on PMNLs. The culture supernatant (CS) from monocyte-derived dendritic cells (moDCs) and from tumour necrosis factor-α (TNF-α) (100 U/ml, 1 hr at 37°)-treated moDCs was harvested after 3 hr, as described in the Materials and methods. Then, the leucocytes were incubated with the CS from moDCs and moDC-TNF-α for 10 min. Finally, PMNLs were stained with monoclonal antibodies (mAbs) to CD18 or to CD11b and analysed by flow cytometry. (b) PMNL migration induced by CS from moDCs and TNF-α (100 U/ml)-treated moDC harvested after 3 hr. Different dilutions of CS were added below the polycarbonate filters and the PMNLs were added above. They were incubated for 60 min, as described in the Materials and methods. The basal (▪) and fMLP (□)-induced PMNL migration is marked on the y axis. (c) PMNL migration induced by CS derived from moDCs treated for 1 hr with different concentrations of TNF-α (10–1000 U/ml). (d) PMNL migration induced by CS (diluted 1: 6) from unstimulated or from TNF-α-treated (100 U/ml) moDCs harvested at different time-points after moDC stimulation. In (a), one representative experiment of three is shown. For (b), (c) and (d), the results are expressed as the percentage of added PMNLs that migrated through the filter, and values represent the mean ± standard error of the mean (SEM) of three or four separate experiments performed in triplicate. **P < 0·01; *P < 0·05 (post hoc Student Newman Kules test).

