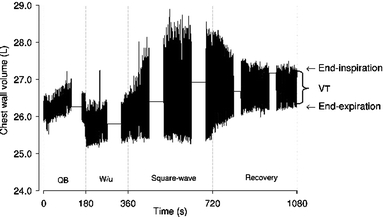
Fig. 1.

Typical example of volume changes of the chest wall during 3 min of baseline measurements (QB quiet breathing), 3 min of unloaded cycling (W/u warming up), 6 min of exercise at the pre-determined  , and 6 min of recovery. Arrows indicate end of expiration and inspiration. Data acquisition was interrupted for 1 min every 2 min in order to allow data storage
