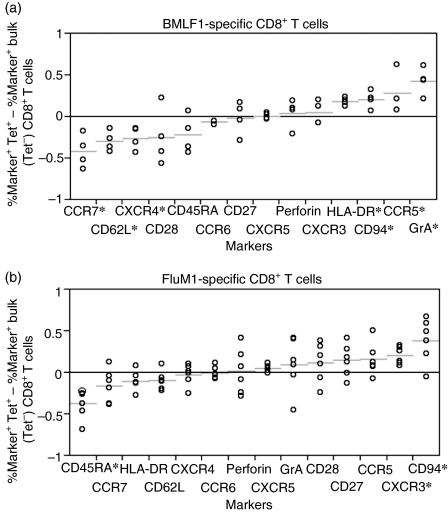
Figure 3.
Comparison of the proportion of marker expression between tetramer+ and tetramer– (bulk) CD8+ T cells. A distribution plot shows the differences between percentages of BMLF1 (4.A) or FluM1 (4.B) tetramers, and corresponding BMLF1– or FluM1– bulk CD8+ T cells expressing surface and intracellular antigens from Tables 2 and 3. The FluM1-responsive donors (01 through 06), and the BMLF1-responsive donors (01, 07 through 09) (4.A) are represented by circles. Short horizontal lines indicate the mean difference of each marker examined. Markers on the horizontal axes are arranged by amount of mean difference, from the lowest (left) to the highest (right). *Indicates that markers with the difference between the mean per cent marker expression of the tetramer+ CD8+ T cells and the mean per cent marker expression of corresponding bulk (tetramer–) CD8+ T cell is statistically significant (P < 0·05).

