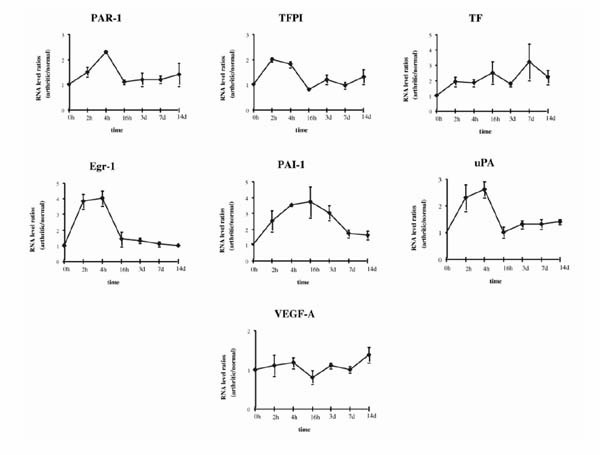
Figure 3.

Time course of accumulation of mRNA from procoagulant and fibrinolytic genes during AIA. RNA levels are expressed as arthritic/normal knee value ratios, after correcting for GAPDH signal. The 0 time point is given the value 1. Values are the mean ± SEM of at least three different mRNA values from three different mice.
