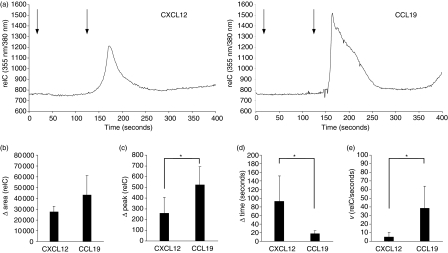
Figure 2.
Intracellular calcium signals of individual DC induced by ligation of CXCR4 and CCR7. FURA2-AM-labelled mature DC were placed on poly-L-lysine-coated cover slides to facilitate adhesion and were maintained in a heated incubation chamber throughout the measurement. A constant flow of RPMI-1640 at a rate of 500 μl/min was generated by using a peristaltic pump and measurement was started after removal of non-adherent cells from the vision field. Bright-field and fluorescence pictures for the emission wavelengths of 355 nm and 380 nm were recorded once a second (one cycle). The chemokine of interest was added to the RPMI-1640 after 20 cycles, then the system was switched to pure RPMI-1640 after another 100 cycles to rinse out any remaining chemokine until the measurement was finished after a total of 400 cycles. (a)Typical calcium responses of individual DC stimulated either with CXCL12 or CCL19 at a concentration of 50 ng/ml. First arrow indicates the addition of chemokine, second arrow indicates the switch to RPMI-1640 for washout (delayed response in relation to actual addition of chemokines is the result of the configuration of the video-microscopic system).(b) The Δ area below the signal curve was calculated by subtracting the total area from the baseline area, representing the kinetics of the relative intracellular calcium concentrations (relC) after stimulation with the respective chemokines at a concentration of 50 ng/ml.(c) Comparison of the Δ peaks elicited by stimulation with CCL19 and CXCL12, which were obtained by subtracting the total peak value from baseline peak value, thus representing the maximum rise of calcium concentrations after chemokine receptor triggering.(d) Comparison of the Δ time, which was defined as the time needed to reach the peak value measured from the baseline value.(e) Comparison of the velocity of calcium increase from the baseline value to the peak value (v = Δ peak/Δ time), expressed as relC/second. Data in (b) to (e) are presented as the mean + SD of the indicated numbers of DC (CCL19: n = 5, CXCL12: n= = 4; *P < 0·05). Data are representative for one of three independent experiments with similar results.

