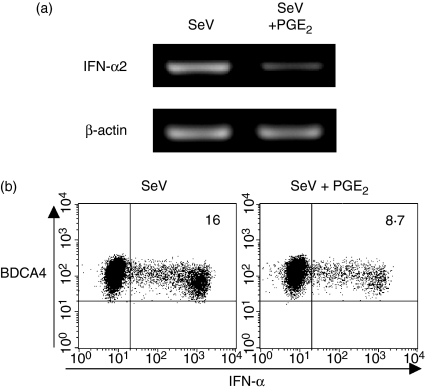
Figure 3.
IFN-α expression in PDCs in response to SeV with or without PGE2 by RT-PCR and intracellular staining. PDCs were cultured for 8 hr with SeV plus vehicle or SeV plus PGE2 (10−6 m). (a) IFN-α2 mRNA expression in PDCs was analysed by RT-PCR. (b) IFN-α staining in PDCs was performed intracellularly by flow cytometry. Percentages of IFN-α-producing PDCs are indicated. Viable PDCs were analysed by exclusion of dead cells on the basis of side- and forward-scatter characteristics. Data represent one of three experiments.

