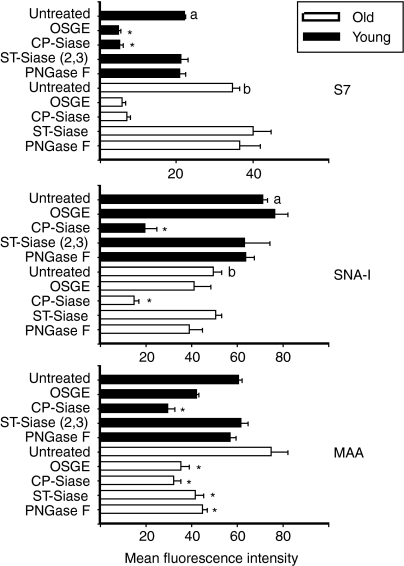
Figure 6.
Analysis of S7 and lectin binding in CD4+ T cells from young and old donors. T cells from young (dark bars) and old (light bars) mice were treated with the indicated enzymes and then incubated with αCD4 and with either FITC-S7 (top panel), SNA-I (middle panel), or MAA (bottom panel). Gated CD4+ cells were then analysed by flow cytometry. Bars represent the mean fluorescence intensity ± SEM of 10 young and 10 old mice from 10 independent experiments. Asterisks (*) indicate significant difference with untreated mice of the same age group (young or old). Letters (a) and (b) indicate significant effects of age.

