Figure 1.

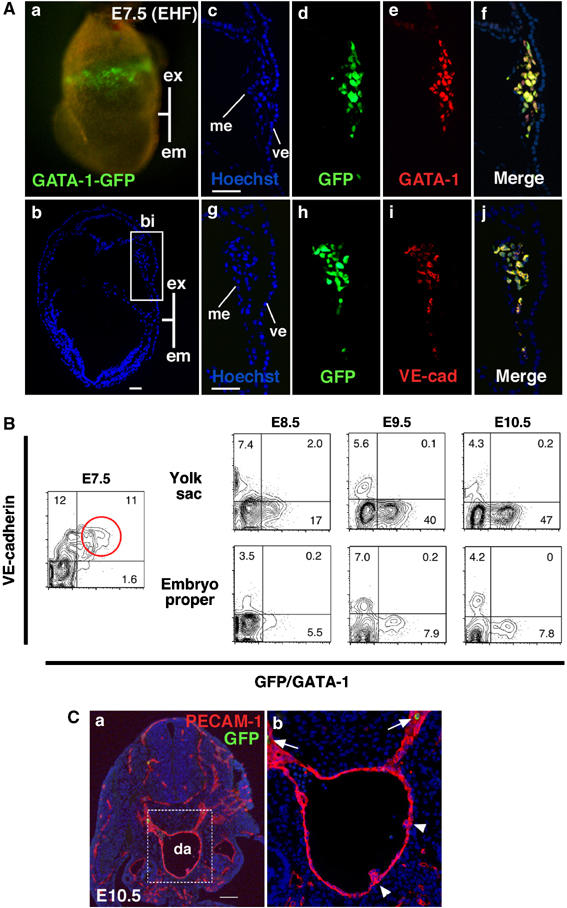
GATA-1+ cells in blood islands coexpress VE-cadherin. (A) Immunohistochemical analysis of G1-HRD-GFP transgenic embryo at E7.5 (early headfold stage, EHF). (a) Fluorescence microscopic analysis shows GFP+ cells are present in the blood islands. (b) Section of (a). The blue color represents staining with Hoechst 33342. (c–j) Serial sections of the blood island depicted in the boxed region in (b). Hoechst dye staining is shown in (c) and (g). Staining with anti-GFP (d and h), anti-GATA-1 (e) and anti-VE-cadherin (i) antibodies are also shown. Merged images of GFP and GATA-1 (f) and GFP and VE-cadherin (j). (B) FACS analysis of G1-HRD-GFP transgenic embryos. Note that most GFP+ cells are positive for VE-cadherin+ (highlighted by a red circle) at E7.5. (C) Immunohistochemical analysis of G1-HRD-GFP transgenic embryo at E10.5. Transverse section of AGM region, stained with anti-GFP (green) and anti-PECAM-1 (red) antibodies. The dorsal aspect is upward. (b) This is higher magnification of the area within (a) indicated by the box. GFP+ cells (white arrows) are observed in circulating cells, not in endothelial cells or hematopoietic cell clusters (white arrowheads). Abbreviations: ex, extra-embryonic region; em, embryonic region; bi, blood island; ve, visceral endoderm; me, mesothelium; da, dorsal aorta. Scale bars: (A) 50 μm; (C) 100 μm.
