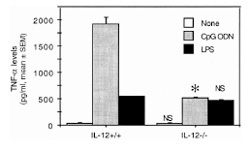
Figure 5.

TNF-α production in vitro by spleen mononuclear cells from IL-12 knockout mice (IL-12–/–) in comparison with cells from their wild-type littermates (IL-12+/+), after stimulation with CpG ODN (1 μm) or lipopolysaccharides (LPS) (1 μg/ml). Values are means and SEM from three mice per group. *P < 0.05. NS = not significant.
