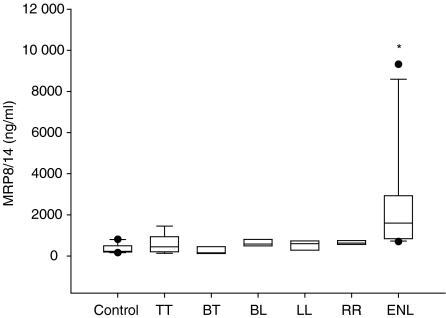
Figure 6.
Serum levels for MRP8/MRP14 in the different forms of leprosy, determined by sandwich ELISA and statistically evaluated by the U-test. Plotted are the median, 10th, 25th, 75th and 90th percentiles as vertical boxes with error bars. Error bar values are column means. An asterisk (*) denotes significant elevation in ENL (U-test according to Mann and Whitney; values of P > 0·05 were considered not to be significant).

