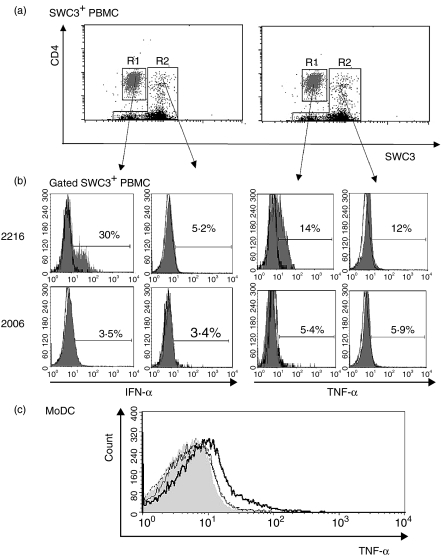
Figure 3.
Detection of interferon-α (IFN-α) and tumour necrosis factor-α (TNF-α) in natural interferon-producing cells (NIPCs) and other SWC3+ subsets after stimulation with CpG-oligonucleotides (ODNs). (a) CD4/SWC3 labelling of sorted SWC3+ cells. This labelling permits the distinction of SWC3low CD4high NIPCs (R1: grey) and of other SWC3+ cells (R2: black). (b) IFN-α and TNF-α staining of NIPCs (R1) and other SWC3+ cells (R2) after incubation with the IFN-α-inducing CpG-ODN 2216 or the non-IFN-α-inducing CpG-ODN 2006, for 6 hr (c) TNF-α expression of monocyte-derived DC (MoDC) treated with medium (grey-filled histogram), lipopolysaccharide (LPS) (bold-line histogram), CpG-ODN 2006 (thin-line histogram) or CpG-ODN D32 (dotted-line histogram).

