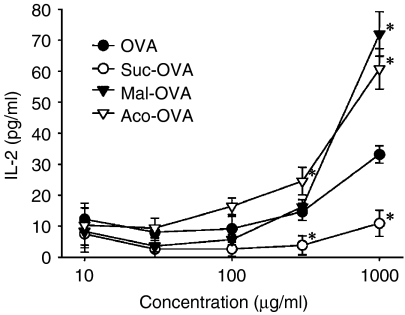
Figure 5.
MHC class I presentation of exogenous native or acylated OVA by DC2.4 cells. DC2.4 cells (5 × 10⁴/well) were incubated with various concentrations of antigen and CD8OVA1.3 T hybridoma cells (105/well) at 37°. After 24 hr, IL-2 production from CD8OVA1.3 T hybridoma cells was measured by ELISA. Results are expressed as the mean ± SD (n = 3). *P < 0·05 versus OVA by Student's t-test.

