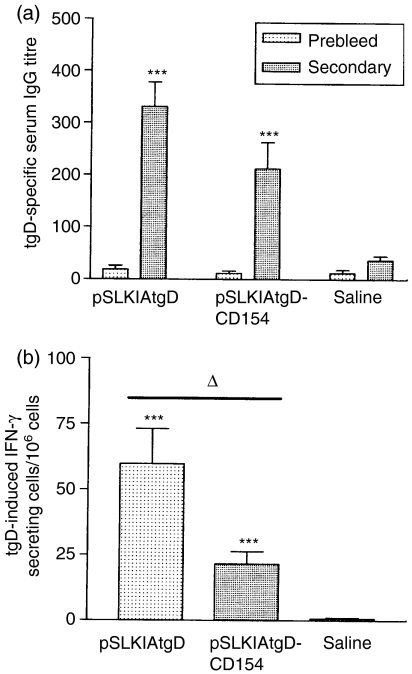
Figure 3.
Immune responses induced in calves by immunization with plasmids encoding tgD or tgD-CD154. Three groups (n=7) of calves were injected intradermally with saline, pSLKIAtgD or pSLKIAtgD-CD154. Responses were measured prior to primary immunization (prebleed) and 3 weeks post-secondary immunization (secondary). (a) tgD-specific mean IgG titres+SEM in sera. The OD reading (+2SD) corresponding to a known reciprocal dilution of standard positive control serum was used as the cut-off value to determine the ELISA titres. (b) Mean number of tgD-induced IFN-γ-secreting cells+SEM in blood. Values were calculated based on the difference between the number of spots per 106 cells in gD-stimulated wells and the number of spots per 106 cells in non-stimulated wells. Asterisks (***P<0·001) indicate significance of differences from the saline injected group. Open triangle (▵, P<0·05) indicates significance of difference between pSLKIAtgD- and pSLKIAtgD-CD154-immunized groups.

