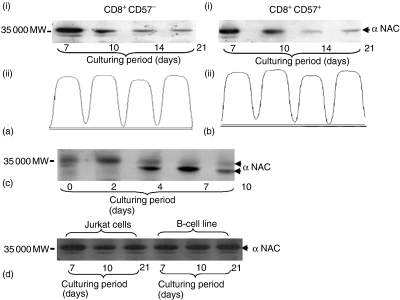
Figure 3.
Expression patterns of α NAC protein. Expression of α NAC protein in CD8+ cells cultured either with AF (a, b) or with anti-CD3 (c) At the indicated time points, cells were either FACS sorted into CD8+ CD57+ and CD8+ CD57– cell populations (ai and bi) or harvested without sorting (c). Cell lysates were resolved on 10% SDS–PAGE. The membrane was probed with polyclonal anti-rabbit against α NAC protein. Densitometry scanning of α tubulin level in the FACS sorted CD8+ CD57+ and CD8+ CD57– cell (aii and bii). Expression of α NAC protein was also investigated in T- and B-cell lines(d).

