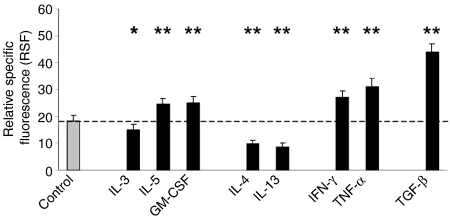
Figure 4.
Cytometric analysis of IL-13Rα1 expression after 20 hr of incubation without stimulus or incubation with the indicated cytokines at the respective concentrations given in the methods (n = 15). Cells were stained with antibody AT-3D3 directed against the IL-13Rα1-chain. Data are expressed as relative specific fluorescence (RSF ± SEM). Asterisks indicate statistical significance of P < 0·05 (*) or P < 0·001 (**) compared to unstimulated control.

