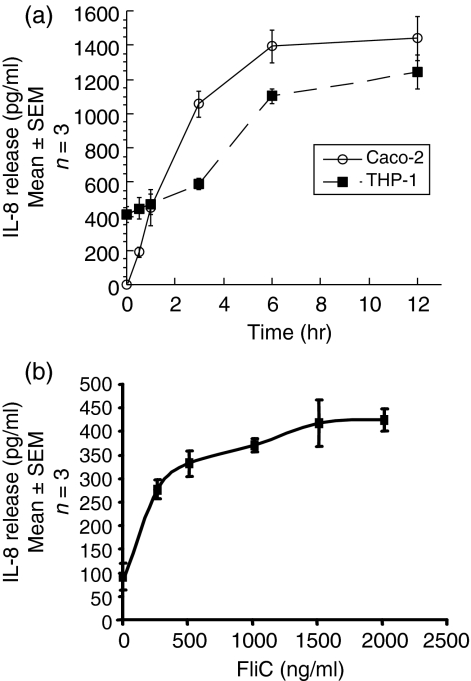
Figure 3.
(a) Time course of FliC-EAEC-induced IL-8 secretion from Caco-2 and THP-1 cells. Undifferentiated THP-1 cells (2 × 10⁶ cells/well) in six-well plates and differentiated Caco-2 cells in 24-well plates were incubated with FliC-EAEC (500 ng/ml) for the times indicated. IL-8 was measured by ELISA.(b)Dose–response of FliC-EAEC-induced IL-8 secretion from THP-1 cells. Undifferentiated THP-1 cells (2 × 10⁶ cells/well) in six-well plates were incubated for 6 hr with increasing doses FliC-EAEC as indicated. IL-8 was measured by ELISA. IL-8 was significantly higher than control for all measured doses of flagellin (P < 0·01, anova).

