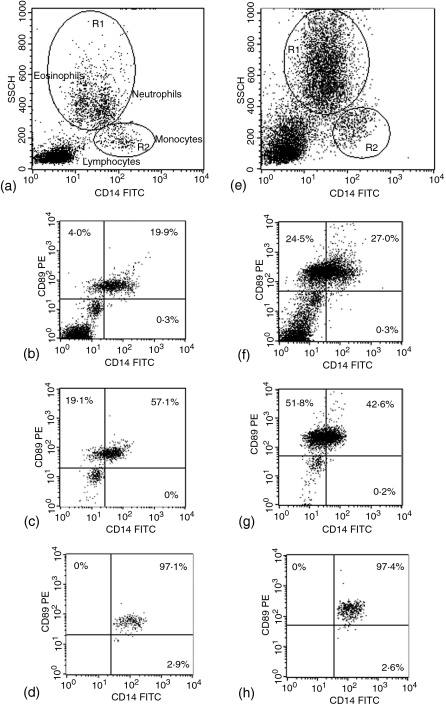
Figure 7.
Two-colour dot-plots of whole-blood leucocytes from a representative rhesus (a–d) and cynomolgus macaque (e–h). (a and e) CD14 versus side scatter. CD14 versus CD89: (b and f) total leucocytes; (c and g) granulocytes; (d and h) monocytes. Gates used for granulocyte (R1) and monocyte (R2) populations of rhesus (a) and cynomolgus macaque (e) are shown.

