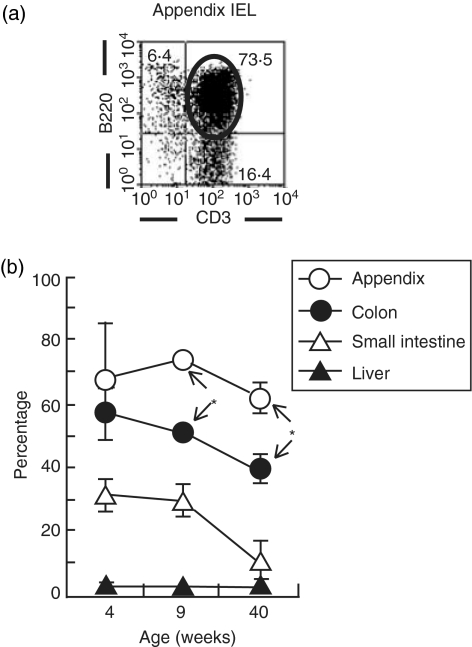
Figure 5.
Identification of B220+ CD3+ cells in the intestine and liver. Two-colour staining for CD3 and CD220 was conducted in IEL of the appendix and other sites. A representative profile of B220+ CD3+ cells in the appendix (a)and the age-dependent variation in the percentages of B220+ CD3+ cells (b) are depicted. *P<0·05.

