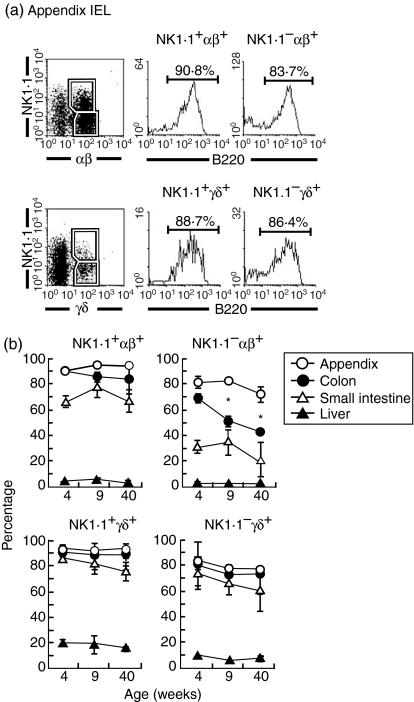
Figure 6.
Further characterization of B220+ T cells. (a)Appendix IEL, (b)age-dependent variation of B220+ T cells in various organs. To characterize B220 expression on T-cell subsets, three-colour staining for TCR-αβ (or TCR-γδ), NK1.1 and B220 was conducted. Numbers in the figure represent the percentages of fluorescence-positive cells in corresponding areas. The experiments for age-dependent variation were repeated (n=4) and the mean and one SD are shown. *P<0·05.

