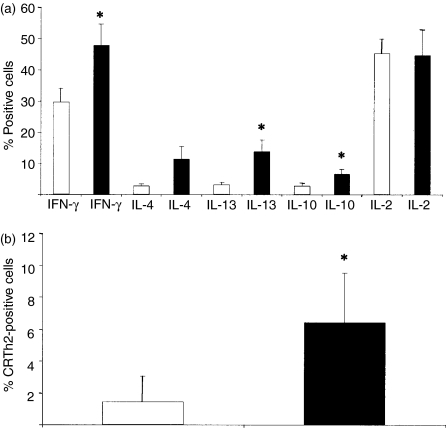
Figure 3.
(a) CD27+ (white bars) and CD27− (black bars) memory T cells were stimulated directly with phorbol 12-myristate 13-acetate (PMA) and ionomycin for 5 hr in the presence of Brefeldin A and assayed for their intracellular cytokine production. The cells were stained for interferon-γ (IFN-γ), interleukin (IL)-4, IL-13, IL-10 and IL-2. The average of four to six independent experiments ± standard error is shown. Statistical analysis was performed by Tukey's test (*P < 0·05). (b) Surface expression of the T helper 2 (Th2) marker, chemokine receptor Th2 (CR-Th2) in CD27+ (white bars) and CD27− (black bars) memory T cells that were analysed by flow cytometry. The average of five independent experiments ± standard deviation is shown. Statistical analysis was performed by analysis of variance (anova) (*P < 0·05).

