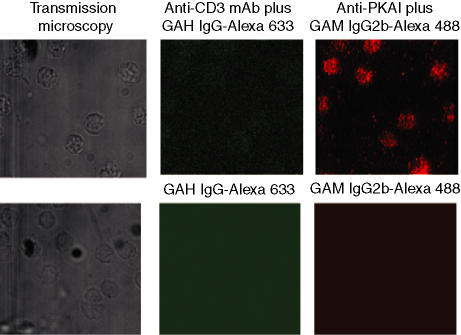
Figure 1.
Distribution of PKA RIα in resting CD4+ T cells and specificity controls. The left panels show transmission micrographs of the same cells as depicted in the middle and right panels. The cells in the upper panels were incubated with anti-CD3 mAb 145-2C11 followed by secondary antibody [goat anti-hamster (GAH) IgG-Alexa Fluor® 633]. The cells were then permeabilized and incubated with anti-PKA I mAb and secondary antibody [goat anti-mouse (GAM) IgG2b-Alexa Fluor® 488]. The incubations were performed at 4° to prevent the activation of the cells. The upper right panel shows distribution of PKA RIα throughout the cell. The cells in the lower panels were incubated with irrelevant control mAbs followed by secondary antibody.

