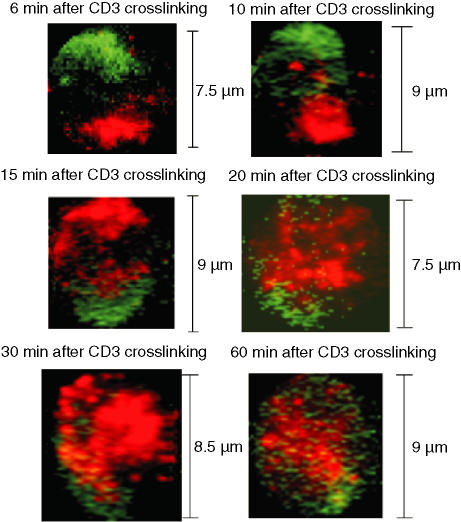
Figure 4.
Distribution of PKA RIα in CD3-cross-linked T cells. CD4+ lymph node T cells from TCR transgenic DO.11.10 mice were either left untreated or cross-linked with anti-CD3 antibody plus goat anti-hamster secondary antibody (green) for the indicated length of time. Then, T cells were stained for PKA RIα (red). During confocal microscopical examination, three or four fields containing CD3-capped T cells were randomly chosen for each slide. Image analyses were performed only on CD3-capped T cells. The images are from one representative experiment of four independently performed experiments in which two to three slides per time point were analysed.

