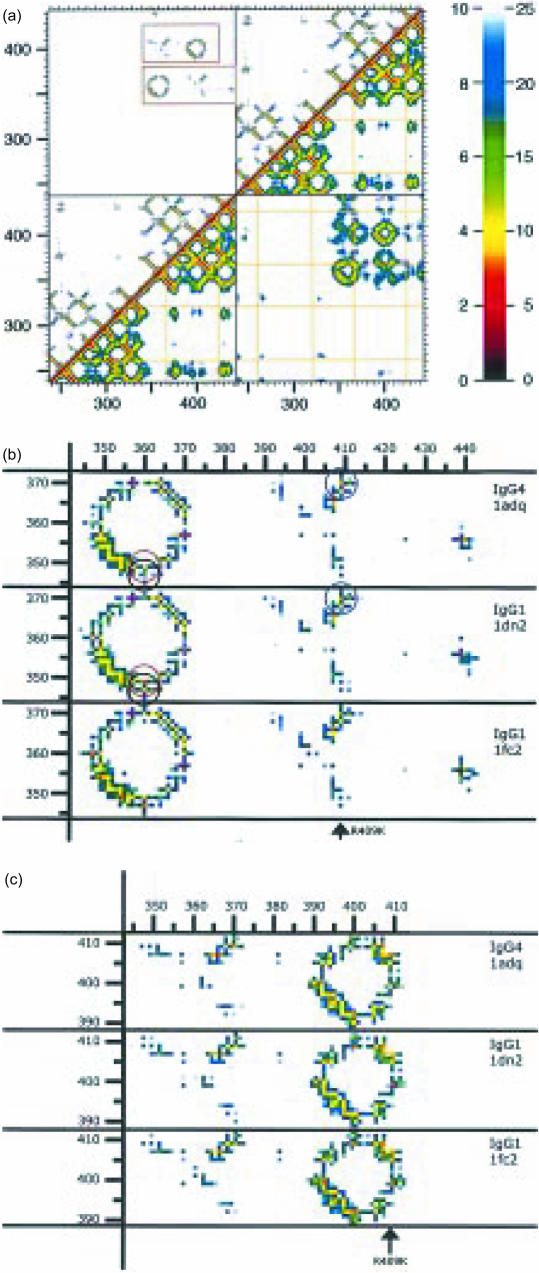
Figure 4.
(a) Proximity plot of the dimer of the Fc fragment of IgG4, as calculated from PDB1ADQ.66 On both the x-axis as well as the y-axis the amino acids of the four domains (CH2 + CH3 of the first H-chain, followed by the CH2 + CH3 of the second H-chain) are indicated by their number in the linear sequence (EU numbering). Every pixel in the graph represents the distance between the pair of amino acids found on the x- and y-axis. These distances are colour-coded according to the key shown on the right: either from 0 to 10 Å (top-left) or from 0 to 25 Å (bottom-right). The top-left half of the figure gives the closest distance between every pair of two amino acids. The bottom-right half of the figure gives the distance between the alpha-carbons of the two amino acids. The yellow lines show the positions of the cysteines. The diagonal is formed by a comparison of each amino acid with itself, so has zero distance. Close to the diagonal the value is determined by the distance between close neighbours in the linear sequence, so it is determined by the secondary structure (shorter distances for amino acids in an alpha helix or in a loop, longer distances for amino acids in beta strands). More distant from the diagonal the distances are among amino acids further apart in the linear sequence, so contacts are determined by the tertiary structure. Examples in the immunoglobulin fold are pairing of beta strands to form beta sheets. The upper-left square and the bottom-right square show the contacts between the two chains. Note the absence of contacts between the amino acids of the two CH2 domains (because of the presence of glycans, not shown). In contrast, the two CH3 domains do make contact. In the upper-left square two regions of contact between the two CH3 domains are outlined. These two are shown in more detail in (b) and (c). (b) A close-up of the lower of the two outlined regions from (a). The corresponding sequences from three IgG structures are shown: PDB1ADQ (IgG4), PDB1DN2 (IgG1) and PDB1FC2 (also IgG1). Comparison between the two IgG1 figures indicates the (small) variability between identical proteins. The three circles drawn in the two upper figures indicate amino acids pairs of which the distances are different in IgG1 compared to IgG4. The black and the red circle highlight two ‘contacts’ of K360, with Q347 and Y349, respectively. The blue circle the ‘contact’ between amino acid 409 (R in IgG4, K in IgG1) and K370. (c) A close-up of the upper of the two outlined regions from (a). The difference in the 370/409 distance has already been pointed out in (b).

