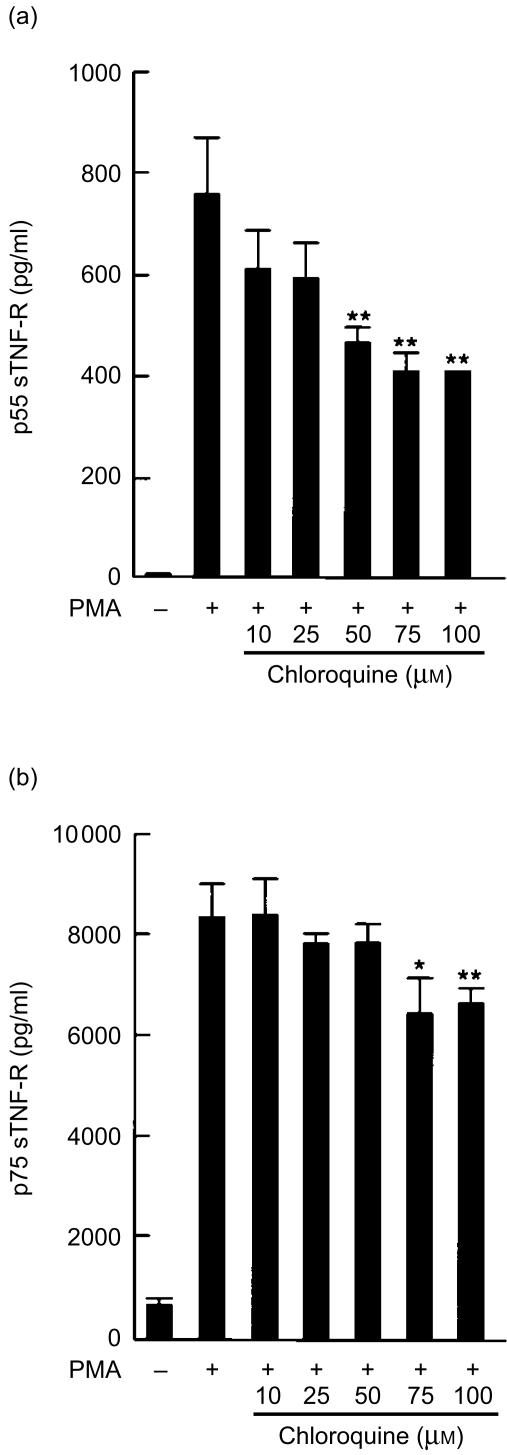
Figure 1.
The effect of chloroquine on the production of soluble p55 and p75 TNF-R (sTNF-R). U-937 cells were incubated with the indicated amounts of chloroquine for 2 hr, and stimulated with PMA (10 ng/ml) for 24 hr. The levels of p55 sTNF-R (a) and p75 sTNF-R (b) released into the culture medium were measured by ELISA. The statistical significance of differences was determined by Student's t- test and results are expressed as mean±SD (n = 3). *P < 0·05; **P < 0·01.

