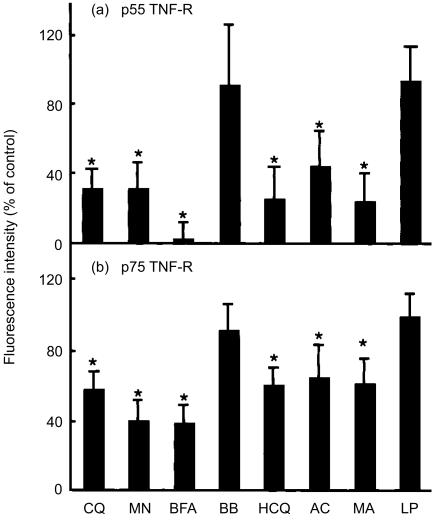
Figure 5.
Chloroquine down-regulates surface expression of p55 and p75 TNF-R on unstimulated cells. U-937 cells were treated with chloroquine (CQ, 100 µm), monensin (MN, 5 µm), brefeldin A (BFA, 5 µg/ml), BB-3103 (BB, 50 µm), hydroxychloroquine (HCQ, 100 µm), ammonium chloride (AC, 10 mm), methylamine (MA, 10 mm) or leupeptin (LP, 250 µm) for 4 hr. Cells were harvested and surface TNF-R expression was analysed as described in Fig. 4. Plots show the level of cell surface TNF-R expressed as a percentage of mean fluorescence intensity of tested cells compared with that of untreated, resting cells. Each value represents the mean±SD of nine independent experiments (n = 9) for p55 TNF-R and that of 12 independent experiments (n = 12) for p75 TNF-R. The statistical significance of differences was determined by the Mann–Whitney test. *P < 0·005.

