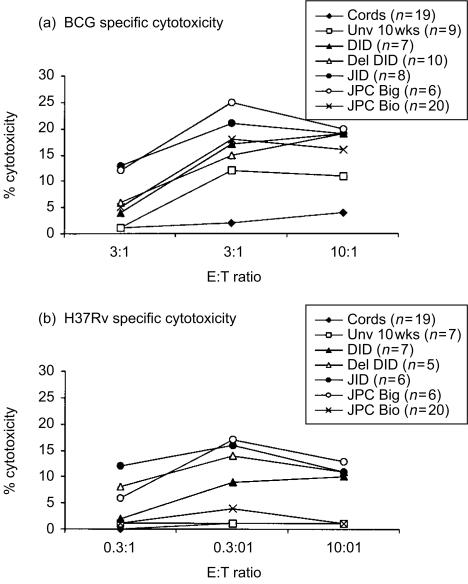
Figure 2.
CTL activity of BCG-stimulated effectors against BCG-infected (a) and H37Rv-infected (b) targets is indicated as mean percentage specific cytotoxicity for three effector to target ratios 10:1, 3:1 and 0.3:1. Standard error of the mean was <5%for all groups. Note that values of the cord group in (b) are superimposed on the Unv 10 week group.

