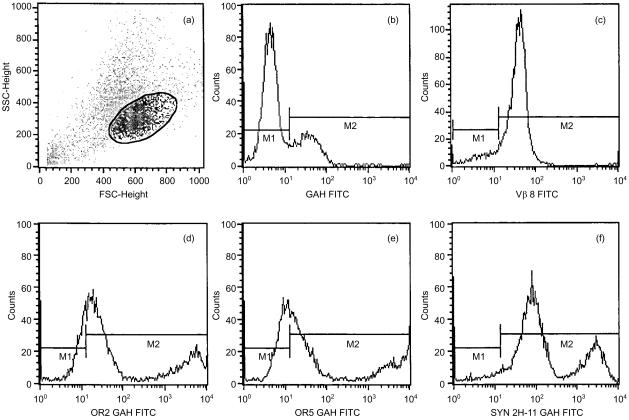
Figure 2.
Binding of anti-human T-cell receptor (TCR) monoclonal antibody to mouse DO-11.10 T cells, as determined by flow cytometric analysis. All cells were single stained with a fluorescein isothiocyanate (FITC) label and are presented on a fluorescence-activated cell sorter (FACS) analysis histogram designating the fluorescence intensity (abscissa) and the number of event counts (ordinate). The plot reads as follows. (a) Forward scatter versus side scatter dot-plot of DO-11.10 cells, with the region designating the cell population examined for binding of anti-TCR monoclonal autoantibodies (mAAbs). (b) Goat anti-human (GAH) immunoglobulin M (IgM) conjugate background binding control. (c) FITC-labelled anti-mouse Vβ 8 positive control. (d) OR2 anti-TCR with GAH FITC conjugate. (e) OR5 anti-TCR with GAH FITC conjugate. (f) Syn 2H-11 anti-TCR with GAH FITC conjugate.

