Figure 4.
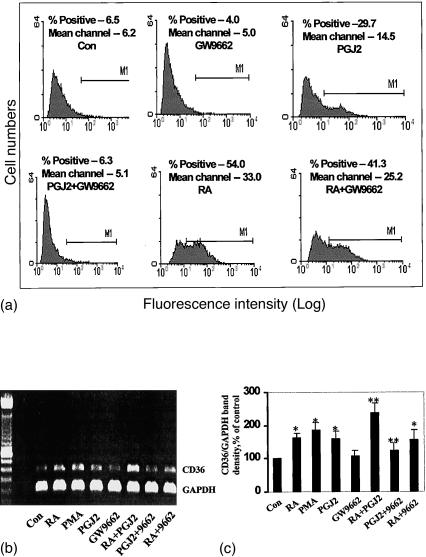
The effect of PPARγ antagonist on CD36 protein and mRNA levels. The cells were cultured for 48 hr in the compounds as indicated. CD36 surface protein was measured by flow cytometry (a), with the filled areas representing specific staining with anti-CD36 monoclonal antibody. Isotype control immunoglobulin as fluorescence background is not shown. CD36 mRNA levels were assessed by RT-PCR (b) using CD36 and GAPDH primers. GAPDH mRNA expression was used as an internal control for normalization purposes. The bar graph (c) represents the mean±SE CD36/GAPDH mRNA levels of at least three independent experiments. * indicates significant differences as compared to the solvent control while ** indicates significance between combination treatment and treatment with RA or 15d-PGJ2 alone (P < 0·05).

